Saturday, October 31, 2020

Making Felt Mongolian Style

 Tanya and I were in Mongolia back in the summer of 2007 on a U of S project. We were treated to a demonstration of how Mongolians make felt with which they construct their Gers or Yurts. The Ger is the traditional dwelling of nomadic herders of the Steppes. Built on a wooden lattice frame, it is lined with felt and then a canvas cover over all. Surprisingly roomy, it is warm in winter and cool in summer. With a stove and stove pipe it is no longer filled with smoke from a fire on the floor and smoke drifting up through a hole in the centre.

A typical Ger, with the bottom lifted and the top open to allow a cooling draft

Our host, in an elaborate traditional costume was a well to do herder with thousands of sheep, goats, cattle and horses

While the basics are as old as herding on the Steppes, the method has been updated a little to take advantage of more modern technology. A plastic sheet under the raw wool for example.

I can't recall how many sacks of raw wool it takes but quite a few. 

The wool is spread evenly about 30 to 40 cm deep on the plastic sheet

Once the wool is spread, it is wetted evenly and thoroughly

It takes a great deal of water to ensure the wool is well soaked

Once the thickness is even and the wool is well wetted, it is ready to roll up

The wool is rolled around a wooden roller

This job is done very carefully to ensure the final product is even
Both ends of the roller have a pipe sticking out over which a rope is looped

Now the boys get involved. The roll is dragged at a walk for many minutes, all the while rolling along on the ground. Then it is unrolled and rerolled tighter and dragged some more only at a trot. 

The distance and timing are carefully counted. the roll is unrolled and rerolled tighter a couple more times and then finally dragged at a full gallop for another set time.
The finished product. Can't remember the dimensions. Maybe 2 meters by 6 meters?

Wool fibres at the beginning

Wool fibres after rolling


Friday, October 23, 2020

How I spent my Covid 19 Social Distancing Time

They claim Sir Isaac Newton invented Calculus during a plague. I may have been that bored but certainly not that smart. I did spend my time playing games with long term temperature data from six weather areas in the Great Plains. This is Les Henry’s fault for the article in Grainews in January and again in March where he first looked at 100 years of data for the Swift Current Research Centre and then included 100 years of data for Fargo and Bismarck. This post is kind of wonkish* so if you are not into weather or numbers feel free to skip it.

Finding long term weather data for Canada is not easy, especially for Western Canada (SRC in Saskatoon goes back to 1966). But once I learned how to use the NOAA website (https://w2.weather.gov/climate ) I could find any number of locations with data going back over 100 years. Except South Dakota, too much missing data, even for a slap happy person like myself, so I skipped it.

I learned several things. First, I have a huge amount of respect for Climatologists. Never mind predicting the future, just making sense out of today’s weather in the greater scheme of things is not easy. Second, rolling averages should be limited to five years, max eleven years, with the average temperature for each period assigned to the centre year: e.g. 1882 is the average of 1880 to 1884, 2017 is the average of 2015 to 2019. Third, to compare temperature change among geographically distant points, one needs to take the difference between the actual measurement and a baseline, usually 30 years. I chose 1951-1980 for no good reason and could have chosen 1961-1990 or even 1981-2010. Next year we will have 1991-2020 to work with. 

I need to thank Raven Onthill and Elaine Wheaton for their assistance. Raven is a fellow blogger with experience in using statistical analysis on meteorological data. Elaine is a retired Climatologist from Saskatchewan Research Council who has contributed to the IPCC Assessment Reports.

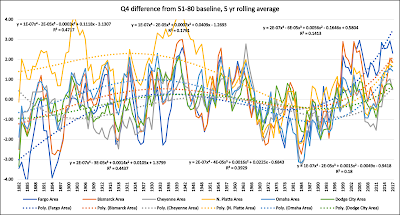
In Figure 1 below, 5 year rolling averages were calculated for annual mean temperatures (all in degrees F, sorry) for six weather areas from North to South. NOAA weather areas include several weather stations not just one. This provides a more accurate temperature than just relying on one station, as every station likely has its own little micro-climate. Trend lines were calculated using 4th order polynomials for no good reason except it made nice curved lines and the largest R2. The larger the R2, the more variability is explained by the trend line. The equations and R2 from left to right match the trend lines for the weather areas from left to right. The upper left is for Fargo etc.


Figure 1, Five Year Rolling Average of Annual Mean Temperatures

That the annual mean temperature increased from North to South was hardly unexpected, but it also increased from west to east for Cheyenne, North Platte (Ogallala) and Omaha weather areas. Since I know nothing about these areas that was unexpected. However, the baseline temperatures from 1981-2010 (Figure 2) illustrated that nicely. The three weather areas may be side by each (Figure 3) but have quite different climates.


Figure 2, Annual Average Mean Temperature 1981-2010

Figure 3, Three weather areas showing number of weather stations

Plotting the annual mean temperature difference from a 1951-1980 baseline and calculating a 5 year rolling average gave me a chart like this (Figure 4), with R2 ranging from 0.77 to 0.40 with four between 0.5 and 0.6 and a marked dip between 1960 and 1990. I sent this to Raven Onthill for comments and he sent me the link to this chart (Figure 5) from page 187 in IPCC AR5 Chapter 2 (reference below) noting that both charts showed a similar dip in temperatures between about 1950 and 1990. Figure 5 is based on world temperature differences from 1961-1990 from four different data sets. I thought “Holy cow, look what I did”.


Figure 4, Five year rolling average of annual mean difference from 51-80 baseline

Figure 5, see reference below

Although I had the data by month, I calculated by quarter as I was lazy and not sure if I would learn much for the work. I may go back and do it anyhow. The following charts are for Q1-Q4. There are certainly seasonal differences in the rolling average trends and R2. Most notable in the 1st 3rd and 4th quarters.


Figure 6, Q1

Figure 7, Q4

Figure 8, Q3

Figure 9, Q2

Elaine Wheaton asked what question(s) I was trying to answer. That was a tough one as I mostly use the Thomas Edison approach which is try something and see what happens. But the question really was whether, if the global climate is changing, can we measure it at our own backdoor. I concluded that it is not that easy, and more than temperature must be considered – precipitation and timing, wind and weather events also come into play. What is happening in one part of the world is not necessarily happening in other parts.

Hartmann, D.L., A.M.G. Klein Tank, M. Rusticucci, L.V. Alexander, S. Brönnimann, Y. Charabi, F.J. Dentener, E.J. Dlugokencky, D.R. Easterling, A. Kaplan, B.J. Soden, P.W. Thorne, M. Wild and P.M. Zhai, 2013: Observations: Atmosphere and Surface. In: Climate Change 2013: The Physical Science Basis. Contribution of Working Group to the Fifth Assessment Report of the Intergovernmental Panel on Climate Change [Stocker, T.F., D. Qin, G.-K. Plattner, M. Tignor, S.K. Allen, J. Boschung, A. Nauels, Y. Xia, V. Bex and P.M. Midgley (eds.)]. Cambridge University Press, Cambridge, United Kingdom and New York, NY, USA.

* not wankish, you Brits.


Friday, October 16, 2020

Religion does not make people stupid.


Two articles showed up in my news feed that I found particularly interesting, especially when they appeared close together (and I needed a subject to blog about).

The first one, “Does Religion make People Stupid?” (https://lsf.org/amherst/does-religion-make-people-stupid) caught my eye as I have tangled with people who take their interpretation of the Bible as the last word in science, history, ethics and so forth. It isn’t pretty.

Does religion make people stupid? No, stupid people make religion stupid. But stupid people make everything stupid.

One of the most common charges laid at the door of organised religion is that it makes people stupid. As one of the most famous of living atheists, Richard Dawkins, puts it, “One of the things that is wrong with religion is that it teaches us to be satisfied with answers which are not really answers at all.” Dawkins isn’t totally wrong; religion does help some people to be satisfied with ‘answers’ that are not really answers at all. But he misses the rather important point that these people are already stupid or, to be slightly more charitable, they are afraid to think properly.

Dawkins is also unquestionably right about the fact that there are no such things as meaningful religious answers to scientific questions. Science succeeds in making the incredible progress it does precisely by excluding certain types of questions from its investigations and calculations. It limits itself to finding out through observation, hypothesis, and experiment, how the physical world works. It, quite rightly, doesn’t bother with questions such as ‘how should I behave?’, ‘what should I hope for?’, ‘how should I feel about reality itself?’ or ‘Is it better to exist or not to exist?’

Nor is religion particularly good at answering specific moral and social questions. Employing religious arguments sheds absolutely no light at all on whether I should support legalised abortion, or which party to vote for at the next election. In fact, as a day-to-day detailed guide in decision making, religion is more often than not completely useless. This is evidenced by the fact that, within my own Church (Roman Catholic), there is absolutely no consensus on most detailed political, social, medical or ethical dilemmas.

It is a short article and there are only 6 more paragraphs, well worth reading.

The second article from Ancient Origins, “Religion Isn’t the Enemy of Science: It’s Been Inspiring Scientists for Centuries” ( https://www.ancient-origins.net/human-origins-science/religion-science-009507 ) brings out noteworthy points about who these scientists were and why they were inspired.

The history of scientific thought is closely linked to that of religious thought, and with much more continuity than discontinuity. The ancient Greek philosopher Aristotle effectively set the Western template for studying the natural world in the 4th century BC. Most of his hugely influential scientific works were lost to Europe after the Roman Empire collapsed, but were developed by Muslim Arab thinkers like Ibn Sina (Avicenna) and Ibn Rushd (Averroes) from around 900AD to 1300AD. Early Islamic figures were responsible for very rapid progress in a number of scientific fields, notably maths, medicine and the study of light (optics).

When Aristotle was reintroduced to Europe in the 12th century, his scientific work had a great influence on medieval scholars, who were invariably thinkers within a church, synagogue or mosque. A key example is the 13th-century Oxford theologian and later Bishop of Lincoln, Robert Grosseteste, who was also a pioneering early scientist. He presented a vision for how we might obtain new knowledge of the universe, the dawning of the first notions of experiment, and even a “big bang” theory of the cosmos and a concept of multiple universes.

When 16th-century philosopher Francis Bacon argued for a new experimental approach to science, he drew explicitly on such theological motivations. As the historian of science Peter Harrison argues, the scientific pioneers who followed Bacon, such as Newton and chemist Robert Boyle, saw their task as working with God’s gifts of senses and minds to recover a lost knowledge of nature.

In fact, science also has roots in ancient Jewish history that are as influential as the ancient Greek precedents. Philosopher Susan Neiman recently argued that the Biblical Book of Job should be understood as a foundation pillar of modern philosophy alongside Plato. This is because Job deals head-on with the problem of an apparently chaotic and fitful world, alien to the human predicament and unmoved in the face of suffering. And this, Neiman claims, is the starting point for philosophy.

It might also be the starting point for science, for Job also contains at its pivotal point the most profound nature poem of all ancient writings. Its verse form of questions is also striking to scientists from all ages, who know that asking the right creative questions – rather than always having the correct answer – is what unlocks progress.

The article is quite short, and it will not take much time to read. The important takeaway is that these people were/are thinkers, not stupid people.

Friday, October 9, 2020

Remembering the Farm - The Dominion Land Survey System


When you grow up on a western Canadian farm, as soon as you leave the blacktop, the Metric System falls by the way and it is miles and acres because that is embedded in our land system and in our DNA. I promised a blog post on Correction Lines. To do that requires an understanding of our land survey system. I am too tired to reinvent the wheel and this PowerPoint presentation (saved as a pdf) explains it far better and clearer than I ever could. It is cear, simple and well illustrated and takes no longer to read than if I wrote a full explanation.

https://www.websiteservice.ca/powerpoints/dominionls.pdf


If you want more details, I suggest the following:

http://kalmakov.com/historical/dominion%20land%20survey.html - history and  detail

https://en.wikipedia.org/wiki/Dominion_Land_Survey more history and detail

And for a fascinating story of how the incredible survey from the Red to the Rockies was accomplished, often in the words of the men who did it, I suggest begging, borrowing or stealing this book. Beginning in 1871, with primitive equipment, facing an empty land and untold hardships, these men managed with a remarkable degree of accuracy to divide 310,000 square miles into small squares suitable for settlement and agriculture.

Vision of an Ordered Land: The Story of the Dominion Land Survey
by James Grierson Macgregor

It is out of print but available from ABEBooks https://www.abebooks.com/


Sunday, October 4, 2020

Saskatchewan Demographics by Census Stated Religion

 Since I posted about Saskatchewan last week, I thought I would tackle this. The back story is that about 10 years ago, a Regina Leader Post article criticized the government for opening the legislative session with prayer. The article was posted on Facebook and drew comments from the usual crowd. Including me. I said that the province had come a long way since it was pretty much either Catholics or Protestants, (with very few exceptions). Christian prayer may have made sense then but not now. 

Whereupon I was shat upon from great heights by two lovely ladies who informed me that Saskatchewan had NEVER been just Catholics and Protestants. I quoted the census data that said otherwise. Their argument was that the First Nations had been forced to give up their traditional beliefs so whatever they put down didn't count. I was cool with that and asked for a reference, suggesting they couldn't just go around making up numbers. They said the census was made up numbers. That ended the conversation.

Since I know people who know people, I was able to get census religious tables with whatever detail they contained for 1901 to 1971. I should have asked for 1981 and 1991 too as what I was able to find was not very detailed. Census tables for 2001 and 2011 were the jackpot when it came to detail. Almost too much.

The reporting format from one 10 year census to the next changed every time. What religion was counted and what was lumped under OTHER was at the whim of the apparatchiki in Ottawa. Just because a religion showed up on one census and not on another did not necessarily mean it wasn't there; it was either pulled out or ignored.

Between 1901 and 1971, there was little change in the overall religious composition. Protestant denominations were added or disappeared but non-Christian religions were almost non-existent. However after 1971, immigration to Saskatchewan took off, especially after 2001. I can hardly wait to add the 2021 census data in a couple years. 

The following tables look at religious distribution in 1911, 1951, 1971 and then 2001 and 2011. 


As the population increased, so did the number of religions. Some were new to the province and some were split out from "Other". The relatively large "Other" in 1911 made me wonder about the attitudes of the tabulators.

The tabulators made up for it in the new century. Not sure what the cutoff was or why some were not listed like the Hutterites (did they ask to be blended in?). People tend to be whatever religion their parents were and will defend to the death the notion that it is the one true faith. The numbers of "No religion" have really taken a jump. Of course, religion is as much a culture as a belief system, like the Irish joke, "Are you a Protestant Atheist or a Catholic Atheist?" 


The United Church of Canada was formed in 1925 from four organizations, including Methodist and 2/3 of the Presbyterian churches. It became the largest Protestant denomination, though membership has steadily declined since 1961. Roman Catholicism dwarfs all the individual Protestant denominations. Anglican and Lutheran membership have declined every census since 1921. Presbyterian membership dropped sharply between 1921 and 1931 with the advent of the United Church. Ukrainian Catholic and Orthodox membership reflects the large inflow of "peasants in sheepskin coats" from Eastern Europe and I am quite sure they were present before 1941.


The Jewish religion was listed separately in every census. Given Canada's history of anti-Semitism, I do not imagine it was out of respect to the Jews. Most of the non-Christian religions showed up after 1971 and especially since 1991. The 2021 census will certainly add to the numbers in these religions. I was pleased to see that Traditional Aboriginal Spirituality was not only listed but increased rapidly between 2001 and 2011. White Man's religion did them nothing but harm. The fastest growing religion seems to be "None" and represented almost 25% of the population in 2011.

So we still have Catholic schools and Public schools but the latter are no longer Protestant school as they were in my father's and my time. They are all-inclusive and need to take that into account so no one is excluded or slighted. The number of religions that celebrate something during our traditional winter holiday season quite astounded me.